Achieve your academic dreams with expert Assignment Help that guarantees top grades and timely delivery.
Get assistance from our PROFESSIONAL ASSIGNMENT WRITERS to receive 100% assured AI-free and high-quality documents on time, ensuring an A+ grade in all subjects.
A person purchased 2 return child tickets and 3 return tickets.
Since the cost of return adult tickets to ‘Edinburg’ is £ 290.00 and the cost of return child tickets to ‘Edinburg’ is £ 100.00 the total price becomes = £ 290.00*3+2*£ 100.00 =£ 1070.00
So, the total cost for these two tickets is £ 1070.00.
Since the total cost of the three tickets is £ 1070.00 and here one adult and one child could not travel and their tickets are refunded then the calculation becomes= £1070.00-(£ 290.00+£ 100.00) =£ 680.00
So the answer is £ 680.00 and the ticket amounts are refunded.
Here the ‘Family and Friends Ticket’ offers 60% off child tickets and 1/3 off adult tickets. A family of one child and two adults were to operate this ‘ticket’ on a return journey to ‘Manchester’. From the delivered table it can be stated that the cost of returning adult tickets to ‘Manchester’ is £ 190.00 and the cost of returning child tickets to ‘Manchester’ is £ 60.00.
Two adult tickets cost £ 190.00*2 = £ 380.00
Now together with the ticket discount the cost of the two adult tickets becomes £ 380.00*? = £ 253.34 (approx.).
Generally, the cost of the child ticket is £ 60.00 but with the ticket discount, it becomes £ 60.00*40% =£ 24.00
Normally in the fundamental ticket price, for this family, the total cost of the journey will be £ 380.00+£ 60.00 =£ 440.00.
But in this case, the family is using the ticket discount. So applying the discounts the total cost of the journey for the family becomes £ 253.34+£ 24.00 = £ 277.34 (approximately)
Without the ticket discount, the total cost is £ 440.00 and with the ticket discount the total cost of the family is £ 277.34, the family saved on this journey £ 440.00-£ 277.34 = £ 122.66 (approx.)
Here, in this case, a faction of 4 adults desire to go on a journey. They are willing to profit from the group discount advertising. They choose on a return trip to either ‘Leeds or Manchester’. They picked to determine to obtain the cheapest value.
So here it is essential to calculate the two types of costs for this group.
First, they will go to Manchester. In that case, the price of return adult tickets to Manchester is £ 190.00 and there are a total of four people. So, the total cost becomes £ 760.00.
Here group discount promotion is available for 4 adults 30% off all tickets. So applying this offer the cost of the ticket becomes £ 190.00-(£ 190.00*30%) =£ 133.00 so as a result the total cost becomes £ 532.00.
Now for the second part, assume that they will go to Leeds. Then In that case, the price of return adult tickets to Leeds is £ 150.00 and there are a total of four people. So, the total cost is £ 600.00.
Here group discount promotion is available for 4 adults 10% off all tickets. So applying this offer the cost of the ticket becomes £ 150.00-(£ 150.00*10%) =£ 135.00 so as a result the total cost becomes £ 540.00.
By observing this calculation it can be said that they should choose the trip to Manchester to get the cheapest deal.
For the increment in costs of the railway company, the present cost of 'tickets to Birmingham' is 5% more than it was earlier year. Now, the cost of a return adult 'ticket to Birmingham' is £ 60.00.
Thereafter, last year the price of a return adult 'ticket to Birmingham' was £ 60.00*100/105= £ 57.14 (approx.)
So, the cost of a return adult 'ticket to Birmingham' the previous year before the upsurge was £ 57.14 (approx.).
Rail National has to resume raising their ticket costs by 5% per year for the next three years.
At present time the price of a return adult 'ticket to Edinburgh' is £ 290.00
Next year the cost will be £ 290.00+£ 290.00*5%=£ 304.50
After the next year, the cost will be £ 304.50+£ 304.50*5%= £ 319.73 (approx.)
And after two years from the present year, the cost will be £ 319.73 +£ 319.73*5% =£ 335.72(approx.)
So, here it can be said that if Rail National decided to restart to grow their ticket costs by 5% per year for the following three years, the price of a return adult 'ticket to Edinburgh' in 3 years would be £ 335.72 (approx.)

Figure 1: Reproduce the Table
(Source: Self-created in Excel)

Figure 2: Calculate Mean Average Monthly Cost of A SIM-Only Contract
(Source: Self-created in Excel)

Figure 3: Calculate Median Number of GB of Data on Offer by the Ten Mobile Networks
(Source: Self-created in Excel)

Figure 4: Calculate Mean Average of GB of Data on Offer by the Ten Mobile Networks
(Source: Self-created in Excel)
The answer in answer (i), which means using the ‘MEDIAN’ to discover the ‘median number’ of GB of data, would deliver an adequate indication of the ‘average number’ of GB of data on recommendation by the 10 mobile networks in this detailed context.
The median is a measurement of the major tendency that is slightly affected by excessive values or deviation in the data (Paul, et al. 2021). If there are periodic unusually low or high prices in the dataset, the median will be undersized and influenced by this deviation compared to the average mean.
The rationale for utilizing the median to sufficiently demonstrate the ‘average number’ of GB of data on request by the 10 mobile networks, as objected to the average mean, is due to the existence of possible outliers or severe values in the dataset.
Outliers and Extreme Values: The median is a strong benchmark of central movement that is not significantly influenced by outliers or excessive values (Little, et al. 2019). Outliers, which are importance significantly lower or higher than the prevalence of the data, can immensely affect the mean. If there are ‘mobile networks’ with extremely low or high data requests, the mean can be changed, directing to a smaller model “average”.
Reflecting Typical Values: The median describes the median value of the dataset when the prices are arranged, and it is less susceptible to severe values. This means it provides an adequate indication of what a distinctive data offer is surrounded by the 10 mobile networks, and of whether there are networks with unexpectedly small or large data offers.
Ensuring Fairness: In specific cases, there might be curiosity to deliver a reasonable representation of the data that is not changed by severe observations (Mishra, et al. 2019). The median performs this, making it a more useful choice when wanting dimensions of central movement that recall the "middle" of the data allocation.
When selecting between ESCOT and Rebala for a ‘SIM-only deal’, I would personally choose ESCOT. Because:
Data Allowance: ESCOT presents an influential 750 GB of 5G data, while Rebala only delivers 30 GB of data. This is a substantial contrast, and if need a large amount of data for operating, downloading, or different data-intensive movements, ESCOT is the more suitable option.
Minutes and Texts: Both ESCOT and Rebala deliver equal text allowances and minutes, so this element doesn't recreate an influential role in the judgment (Meeker, et al. 2022).
Monthly Cost: ESCOT is valued at $12.00 per month, whereas Rebala is valued at $5.00 per month. While Rebala is cost-effective on the basis of the month, the significant distinction in data allowance explains the higher cost of ESCOT, particularly if depends laboriously on data.
Contract Duration: Both ESCOT and Rebala hold a 12-month agreement, so there's no influential contrast in terms of responsibility.
In overview, ESCOT delivers a considerably bigger data allowance, which can be a critical aspect for multiple users who rely on data for different online actions. While it's valued barely higher than Rebala (Manoukian, 2022), the additional data capacity more than explains the cost difference, making ESCOT the excellent choice for those who require comprehensive data for the use of their smartphone.

Figure 5: Calculate the Percentage of Recorded Offences of Shoplifting Were Groceries in 2022/23
(Source: Self-created in Excel)
There are two initial reasons why groceries may contain a ‘higher percentage’ of shoplifting compared to other types of items:
Necessity and Consumption Frequency: Groceries are essential to daily life, and individuals buy them regularly. This high need for groceries indicates that they are more often targeted by shoplifters (Eremeev, et al. 2020). Since groceries are unstable or consumable goods, there is an invariant requirement to reload them, making them an appealing target for those examining to meet their primary requirements without obtaining costs.
Ease of Concealment and Lower Perceived Risk: Groceries are generally smaller and slightly costly compared to objects in other categories, like homeware or electronics. This makes them easier to suppress in bags or clothing, lowering the sensed risk of anxiety by shoplifters. Shoplifters might sense groceries as low-risk marks, particularly if they acknowledge that security benchmarks are less severe for these objects in contrast to higher-priced interests. Additionally, data analysis in Computer Science Assignment Help can be used to develop advanced security algorithms that detect shoplifting patterns and prevent theft more effectively
These elements, among others, donate to groceries having a ‘higher percentage’ of shoplifting incidents in multiple issues.
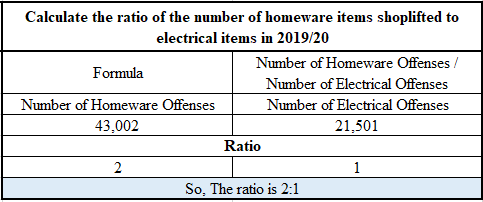
Figure 6: Ratio of the Number of Homeware Items Shoplifted To Electrical Items in 2019/20
(Source: Self-created in Excel)
The ratio of 2:1, denoting the item number of homeware shoplifted to electrical items in 2019/20, has a detailed performance. In other phrases, homeware theft happened at twice the velocity of electrical theft (Shulenin, 2020). This ratio delivers a comparative comparison of the regularity of shoplifting in these two varieties. It means that, within the circumstances of shoplifting in 2019/20, homeware things were more continually targeted or registered as stolen compared to electrical objects, signifying a higher appearance of theft in the homeware variety.
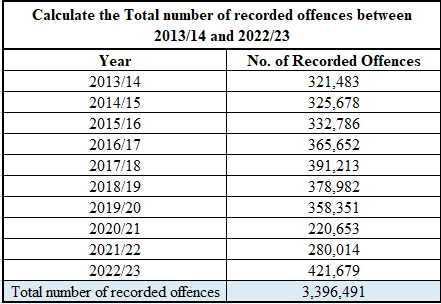
Figure 7: Calculate the Total Number of Recorded Offences between 2013/14 and 2022/23
(Source: Self-created in Excel)
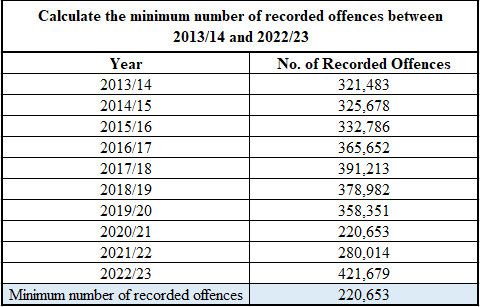
Figure 8: Calculate the Minimum Number of Recorded Offences between 2013/14 and 2022/23
(Source: Self-created in Excel)
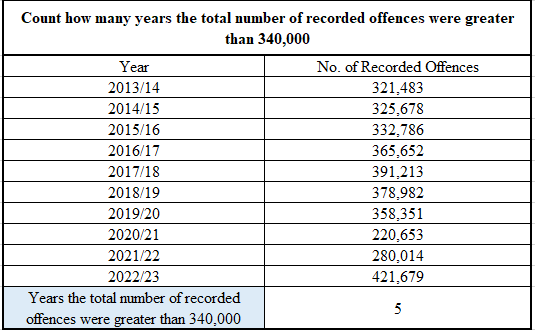
Figure 9: Calculate the Count How Many Years the Total Number of Recorded Offences Were Greater Than 340,000
(Source: Self-created in Excel)
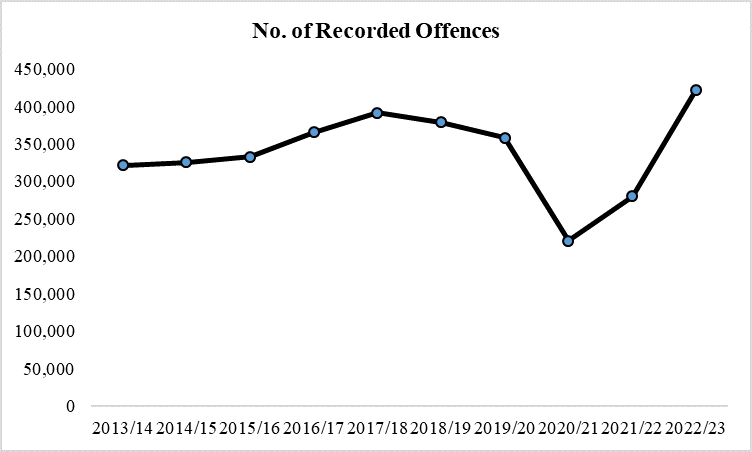
Figure 10: Graph of Total Number of Recorded Offences in Each Year from 2013/14 to 2022/23
(Source: Self-created in Excel)
The data on registered shoplifting offences between ‘2013/14 and 2022/23’ delivers a significant trend with both dips and peaks.
Overall Increasing Trend: From ‘2013/14 to 2017/18’, there was a constant rising trend in registered shoplifting offences (Kim, et al. 2021). The decimal of offences frequently raised from 321,483.00 to 391,213.00 by this period. Various aspects might contribute to this trend, like changing law enforcement methods, advanced reporting, or economic circumstances.
Dip and Peak: An effective peak was obeyed in 2016/17 when the digit of registered offences streamed to 365,652.00. This might be attributed to a mixture of elements, containing changes in societal conditions, law enforcement efforts, and economic factors. After the peak, there was a prominent dip in 2018/19 to 378,982.
Fluctuations: The data indicates fluctuations in the following years i.e. 2019/20 to 2022/23. Shoplifting offences dropped to 358,351.00 in 2019/20 but then grew to 421,679.00 in 2022/23. These fluctuations could be caused by a variety of elements (Janse, et al. 2021), involving social conditions, store security measures, and differences in the economic climate.
In overview, while there is a general developing trend in registered shoplifting offences, the ‘dips and peaks’ suggest that a critical interplay of social, economic, and law enforcement aspects affects shoplifting rates.
A proper graph to demonstrate the ‘correlation between sales and advertising’ is a ‘scatter plot’. A ‘scatter plot’ is a variety of graphs that shows particular data points on a ‘two-dimensional craft’, with one variable i.e. income from sales on the “x-axis” and the other variable i.e. cost of advertising on the “y-axis” (Hilasaca, et al. 2023).
In this case, here can utilize the data that have been gathered for the ‘income from sales’ and the ‘cost of advertising’ per year to construct the ‘scatter plot’ (Makowski, et al. 2020). This will help to specify whether there is a ‘correlation’ between sales and advertising cost, and if so, the character of that correlation becomes negative, positive, or no correlation.
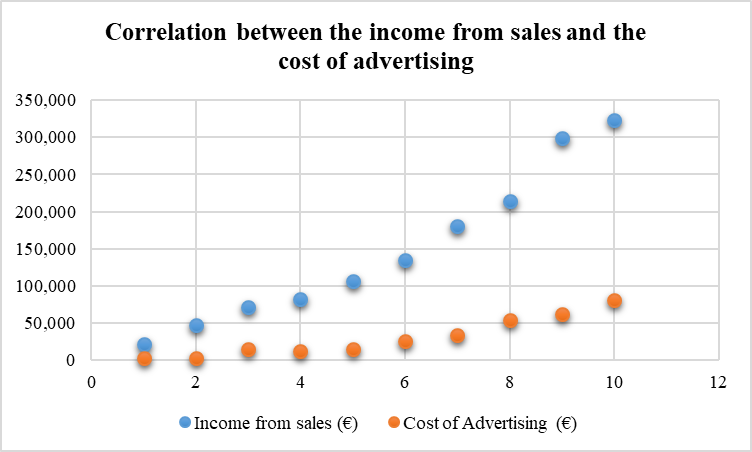
Figure 11: Graph to Show the Correlation between the Income from Sales and the Cost of Advertising
(Source: Self-created in Excel)
Based on the above graph’s data, it appears that there is a ‘positive correlation’ between ‘income from sales’ and the ‘cost of advertising’. As the price of advertising grows, the ‘income from sales’ also tends to grow. This is apparent from the prevalent trend in the data, where more increased advertising expenses are connected with higher figures of sales.
The ‘scatter plot’ of the data points would probably deliver an upward-sloping practice, demonstrating a ‘positive linear correlation’ (Strain, et al. 2023). This means that, in the conditions of the ‘Mini-Zoo Pet Store in Berlin’, funding more in promotion has a positive effect on sales implementation. Regardless, the correlation does not indicate causality, and other characteristics may also affect sales.
The positive correlation between ‘income from sales’ and the ‘cost of advertising’ implies that in the circumstance of the ‘Mini-Zoo Pet Store in Berlin’, there is a connection where more increased spending on promotion is correlated with higher sales income. In realistic terms, this signifies that funding more in advertising movements, marketing efforts, or promotions can have a profitable effect on the store's sales implementation.
As the manager of the ‘Mini-Zoo Pet Store’, there are various methods to evaluate for growing sales further next year:
Expand Product Range: Evaluate consumer demands and consider counting new products or benefits that are set with existing market trends. This can draw a broader consumer base.
Customer Engagement: Improve consumer service and employment through feedback collection, personalized recommendations, and loyalty programs to create a loyal consumer base.
Online Presence: Boost online presence by enhancing the store's website and employing e-commerce (McGuire, et al. 2019). This encourages consumers to shop online, particularly if there's a climb in online shopping due to the altering market landscape.
Marketing and Advertising: Since there's a ‘positive correlation’ between advertising spend and sales, consider assigning higher funding for advertising. Utilize both digital and traditional marketing media to achieve a broader audience.
Inventory Management: Execute efficient inventory management strategies to decrease costs and control stockouts or overstocking.
Market Research: Remain updated with market research and industry trends. This can aid in determining emerging possibilities and threats.
By executing a variety of these techniques while observing the effect on sales, here can work towards improving the store's income in the forthcoming year.
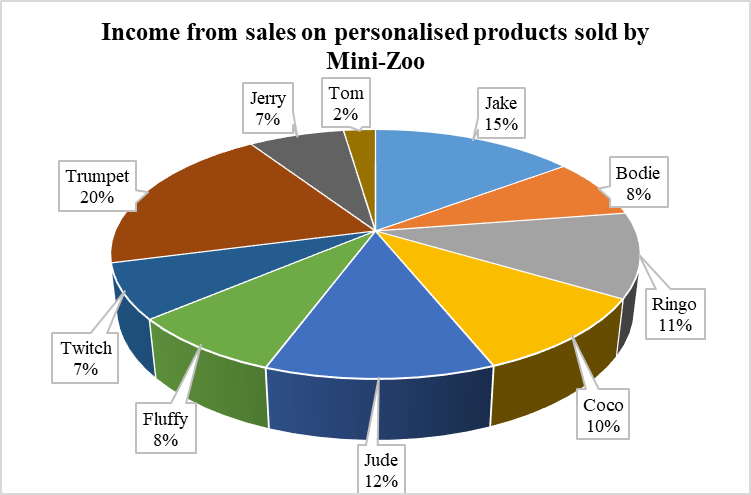
Figure 12: Pie Chart to Show the Income from Sales of the Most Popular Pet Names Sold By Mini-Zoo
(Source: Self-created in Excel)
The largest sector of the pie chart describes the pet “Trumpet” which does not naturally suggest that it is the famous pet for various reasons. While the chart demonstrates that "Trumpet" yielded the highest revenue, popularity is not exclusively defined by income. Some key reasons for this discrepancy are:
Pricing Structure: The pricing for customized is not constant across pet s. "Trumpet" has ‘7 letters’, and separate further letter costs €0.50. Thus, it inherently generates more revenue due to its lengthier . This doesn't certainly reflect its favor among pet proprietors but rather the expense associated with customizing products with this .
Different Customer Base: Mini-Zoo's consumers may have variable preferences for customization. Some consumers might prefer s such as "Trumpet" for detailed reasons, while others may choose shorter s such as "Tom" or "Jerry." This variety in choices can lead to deviations in income without displaying popularity.
Marketing and Promotion: The popularity of pet s can be affected by seasonal, trends, or marketing factors. A concerted measure in broadcasting specific s could guide to improved sales and income without glancing at intrinsic popularity.
Cultural and Regional Differences: The popularity of pet s can also change based on regional and cultural aspects. Some s may be famous in particular areas or within specific communities, which can bias the income allocation.
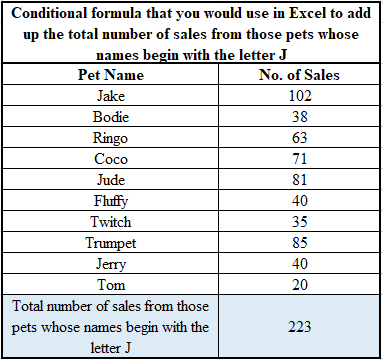
Figure 13: Calculate the Total Number of Sales from Those Pets Who’s Names Begin with the Letter J
(Source: Self-created in Excel)
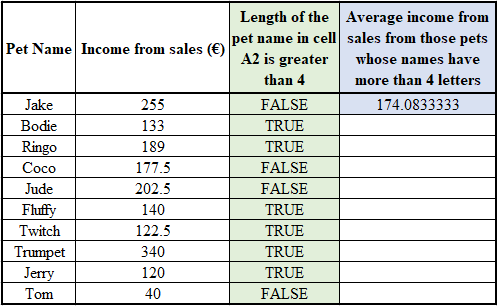
Figure 14: Calculate the Average Income from Sales from Those Pets Whose Names Have More Than 4 Letters
(Source: Self-created in Excel)
References
Journals
Task 1 The training and CPD sample demonstrates how effective training can enhance staff skills. For assignments on hospitality...View and Download
Reflective Commentary Get free samples written by our Top-Notch subject experts for taking assignment...View and Download
Introduction: A Guide to Effective HR Policies Get free samples written by our Top-Notch subject experts for...View and Download
Introduction With the support of Affordable Online Assignment Help Experts, gain in-depth insights into how cultural and...View and Download
Introduction Get expert guidance on Affordable Online Assignment Help Experts for secure data handling, privacy laws, and best...View and Download
Introduction and Background Here’s an assignment sample that reflects clarity, precision, and academic depth. At Rapid...View and Download
Copyright 2025 @ Rapid Assignment Help Services
offer valid for limited time only*

