Enhance Your Understanding of Accounting Information Systems with Expertly Crafted Assignment Samples for Better Financial Management and Decision-Making.
With Rapid Assignment Help, enjoy personalized support and premium-quality Assignment Help for guaranteed results.
| 2024 | 2025 | ||||||||||||||||||||||||
| Jan | Feb | March | Apr | May | June | July | Aug | Sep | Oct | Nov | Dec | Jan | Feb | Mar | Apr | May | June | July | Aug | Sep | Oct | Nov | Dec | ||
| INFLOWS | |||||||||||||||||||||||||
| Project sales | 2205000 | 2359350 | 2524504.5 | 2701219.82 | 2890305.20 | 3092626.57 | 3309110.43 | 3540748.16 | 3788600.53 | 4053802.56 | 4337568.74 | 4641198.55 | 4966082.45 | 5313708.23 | 5685667.80 | 6083664.55 | 6509521.07 | 6965187.54 | 7452750.67 | 7974443.21 | 8532654.24 | 9129940.04 | 9769035.84 | 10452868.35 | |
| TOTAL INFLOWS | A | 2205000 | 2359350 | 2524504.5 | 2701219.815 | 2890305.202 | 3092626.566 | 3309110.426 | 3540748.156 | 3788600.527 | 4053802.563 | 4337568.743 | 4641198.555 | 4966082.454 | 5313708.225 | 5685667.801 | 6083664.547 | 6509521.066 | 6965187.54 | 7452750.668 | 7974443.215 | 8532654.24 | 9129940.037 | 9769035.839 | 10452868.35 |
| OUTFLOWS | |||||||||||||||||||||||||
| Design, Patents & Trademarks | 12,00,000 | 12,00,000 | 12,00,000 | 1224000.00 | 1248480.00 | 1273449.60 | 1298918.59 | 1324896.96 | 1351394.90 | 1378422.80 | 1405991.26 | 1434111.08 | 1462793.30 | 1492049.17 | 1521890.15 | 1552327.96 | 1583374.52 | 1615042.01 | 1647342.85 | 1680289.70 | 1713895.50 | 1748173.41 | 1783136.88 | 1818799.61 | |
| Production Machinery | 41,75,000 | 36,25,000 | 31,25,000 | 3187500.00 | 3251250.00 | 3316275.00 | 3382600.50 | 3450252.51 | 3519257.56 | 3589642.71 | 3661435.57 | 3734664.28 | 3809357.56 | 3885544.71 | 3963255.61 | 4042520.72 | 4123371.13 | 4205838.56 | 4289955.33 | 4375754.43 | 4463269.52 | 4552534.91 | 4643585.61 | 4736457.32 | |
| Warehouse | 22,50,000 | 22,50,000 | 22,50,000 | 2295000.00 | 2340900.00 | 2387718.00 | 2435472.36 | 2484181.81 | 2533865.44 | 2584542.75 | 2636233.61 | 2688958.28 | 2742737.44 | 2797592.19 | 2853544.04 | 2910614.92 | 2968827.22 | 3028203.76 | 3088767.84 | 3150543.19 | 3213554.06 | 3277825.14 | 3343381.64 | 3410249.27 | |
| Advertising (UK) | 22,50,000 | 4,75,000 | 5,25,000 | 535500.00 | 546210.00 | 557134.20 | 568276.88 | 579642.42 | 591235.27 | 603059.98 | 615121.18 | 627423.60 | 639972.07 | 652771.51 | 665826.94 | 679143.48 | 692726.35 | 706580.88 | 720712.50 | 735126.75 | 749829.28 | 764825.87 | 780122.38 | 795724.83 | |
| Advertising (Global) | 5,00,000 | 4,50,000 | 5,00,000 | 510000.00 | 520200.00 | 530604.00 | 541216.08 | 552040.40 | 563081.21 | 574342.83 | 585829.69 | 597546.28 | 609497.21 | 621687.15 | 634120.90 | 646803.32 | 659739.38 | 672934.17 | 686392.85 | 700120.71 | 714123.12 | 728405.59 | 742973.70 | 757833.17 | |
| TOTAL OUTFLOWS | B | 1,03,75,000 | 80,00,000 | 76,00,000 | 7752000.00 | 7907040.00 | 8065180.80 | 8226484.42 | 8391014.10 | 8558834.39 | 8730011.07 | 8904611.30 | 9082703.52 | 9264357.59 | 9449644.74 | 9638637.64 | 9831410.39 | 10028038.60 | 10228599.37 | 10433171.36 | 10641834.79 | 10854671.48 | 11071764.91 | 11293200.21 | 11519064.21 |
| NET CASH FLOW | -81,70,000 | -56,40,650 | -50,75,496 | -50,50,780 | -50,16,735 | -49,72,554 | -49,17,374 | -48,50,266 | -47,70,234 | -46,76,209 | -45,67,043 | -44,41,505 | -42,98,275 | -41,35,937 | -39,52,970 | -37,47,746 | -35,18,518 | -32,63,412 | -29,80,421 | -26,67,392 | -23,22,017 | -19,41,825 | -15,24,164 | -10,66,196 | |
| OPENING BANK BAL | C | -245100 | -169219.5 | -152264.865 | -151523.4056 | -150502.0439 | -149176.627 | -147521.2197 | -145507.9785 | -143107.0158 | -140286.2553 | -137011.2766 | -133245.149 | -128948.2541 | -124078.0956 | -118589.0951 | -112432.3753 | -105555.526 | -97902.35493 | -89412.62072 | -80021.74713 | -69660.51725 | -58254.74624 | -45724.93111 | -31985.87597 |
| CLOSING BANK BAL (A-B)+C | -84,15,100 | -58,09,870 | -52,27,760 | -52,02,304 | -51,67,237 | -51,21,731 | -50,64,895 | -49,95,774 | -49,13,341 | -48,16,495 | -47,04,054 | -45,74,750 | -44,27,223 | -42,60,015 | -40,71,559 | -38,60,178 | -36,24,073 | -33,61,314 | -30,69,833 | -27,47,413 | -23,91,678 | -20,00,080 | -15,69,889 | -10,98,182 |
Table 1: Monthly Cash Flow Forecast for the 24 months
According to the above table a company's whole financial outlook for the years 2024 and 2025. In the end, it results in the computation of net cash flow and the organization's closing bank balance by outlining the anticipated inflows and outflows for each month. Let's examine this financial forecast in more detail.
The table's "Inflows" column includes forecasts for "Project Sales." These are the company's project-related revenues, which seem to have progressively increased over the past two years. The figures are given in thousands, and the "Total Inflows" row calculates and displays the monthly total inflows. In January 2024, a forecast monthly sales level of £2,205,000 is expected, with monthly sales progressively rising after that. The anticipated monthly sales will amount to £10,452,868.35 by January 2025. These numbers appear to show a steady growth trend, showing the company's improving performance in sales over the previous two years.
The table's outflows column provides information on the anticipated costs or outflows for several categories. Moreover, it is clear that although some of the aforementioned groups have continuous, gradual growth, others go through dramatic transformation (Monteiro and Cepêda, 2021). The "Total Outflows" row displays the sum of all monthly costs, combining the various categories. The expenditure category for design, patents, and trademarks will stay the same in 2024 at £1,200,000 per year. However, it significantly rises to £1,214,200 in January 2025. This can be because of certain contractual requirements or licensing costs.
Production Machinery costs fall under this category, with a starting cost of 4,175,000 in January 2024 and a final cost of 4,633,585.61 in December 2024. However, there was a notable increase in January 2025, reaching 4,736,457.32. The pattern of a downward trend accompanied by an upward trend might point to a planned purchase of manufacturing equipment in the coming year. The trend of production machinery expenditures is mirrored in warehouse expenses. They begin at 2,250,000 in January 2024, progressively go down, and then jump to 3,413,249.27 in January 2025. This can be a sign that the warehouse will soon be renovated or expanded.
Publicity (UK & World) Both advertising costs increase in January 2024, fall over the following months, and then rise again in January 2025. The organization's advertising strategy, which places a higher emphasis on the start of the year, maybe tied to this tendency.
A significant statistic is the "Net Cash Flow" row, which shows the difference between monthly inflows and outflows. The existence of a positive net cash flow indicates profitability, whereas a net cash flow that is not profitable means that the organization is losing money each month. Throughout the whole predicted period, the firm has negative cash flows (Kocsis, 2019). This indicates that the business, on average, spends more money than it brings in each month. The largest negative net cash flow, with an estimated value of -10, 66,196, occurs in January 2025. The combination of higher costs and seasonal variations in project sales may be to blame for this.
The starting and closing bank balances for the corporation are shown in the table. These balances reflect how much money the business has in cash and other liquid assets at both the start and finish of each month. Since the corporation had a negative initial bank balance in January 2024, the year had already begun with a deficit. The net cash flow is multiplied by the opening bank amount to arrive at the closing bank balance for each month (Alawaqleh, 2021). Additionally, it demonstrates that the business always has a deficit at month's end. The corporation faces difficulties in 2025, as seen by the closing bank balance of -84, 15,100, which is a sizable deficit.
Over the next two years, the business anticipates a consistent increase in project revenues. This is encouraging and implies that the company's sales tactics are successful.
The considerable rise in spending for categories like Design, Patents and trademarks, Production Machinery, and Warehouse in January 2025 indicates that the corporation anticipates making sizable investments or outlays at the beginning of the year.
The company's costs regularly outpace its income, as seen by the persistent negative net cash flows. This prompts questions about the company's capacity to sustain its financial position and the requirement for expense control or improved revenue development.
Each month's start and end bank balances for the corporation display a deficit. This can mean that the business is depending on loans and credit to pay for its operating costs.
In order to boost its financial stability, the firm should think about adopting a more balanced cash flow strategy that aims for profitability and favourable net cash flows. The company's anticipated economic performance for 2024 and 2025 is shown in this financial forecast table. To raise its financial stability and attain profitability, the firm must carefully manage its costs and look for methods to boost income (Lutfi et al. 2022). The high increases in costs in January 2025 point to important plans for the coming year, but they should be carefully controlled to make sure they are consistent with the financial goals of the business.
The usability and functionality of an interactive spreadsheet may be greatly improved by adding conditional statements to automate computations and hyperlinks for navigation. In this explanation, we'll go through how to create an Excel spreadsheet with menus for simple navigation and IF statements for calculating bank interest and making purchases of machines.
| Selling Price | 245 per unit | IF Statement |
| Sales in January 2024 | 9,000 | 1084860 |
| Direct Materials per unit | 120 | 14464.8 |
| Direct Wages per unit | 42 | 1764 |
| Variable Production Overhead per unit | 37 | 1375.1605 |
| Overdraft Limit | 30,00,000 | 9000000 |
| Machinery Purchase Cost | 90,00,000 | 10102463.96 |
Table 2: Calculation of bank interest and new machinery
The primary interface for navigating the spreadsheet will be a menu system with hyperlinks. The first worksheet may be used to construct this menu system, which serves as a dashboard. Each menu item may have a hyperlink that, when clicked, will direct to the relevant spreadsheet area. This menu option may be connected to a spreadsheet cell where may enter the cost of sale and determine sales for a given time frame (Al-Dalaien and Dalayeen, 2018). Moreover, to automatically determine the total sales, utilize IF statements. Based on the organization's overdraft limit, this part can compute bank interest and give a link to more information or alternatives about bank interest.
A thorough financial overview is provided in this part, along with a rundown of the most important financial indicators and bank balances. The formula created a specific section in the spreadsheet where the user enters pertinent information, such as the amount of the overdraft limit, interest rate, and present bank balance, to add IF statements for bank interest computation. These variables may be utilized to determine the interest using the IF statement. The current bank account balance is checked to see if it is positive (signifying a surplus) in this IF statement, and if it is, the interest rate is added to it. There is no interest collected on an overdraft, thus if the balance is below (signifying an overdraft), it provides 0.
A separate part for the equipment buys decision where the user can enter the machinery purchase price, the company's financial status, and the purchase choice criteria. Individual may use an IF chart to determine if the firm can afford the machinery if cell A2 represents the cost of the machinery and cell B2 represents the enterprise's current bank balance. If it is, it returns "Affordable," meaning the business can afford the equipment. If it's untrue, it responds "Not Affordable." Important financial data including balances in the bank, net cash flow, and the outcomes of the machinery purchase choice may be seen in the Financial Summary section. The menu system has a link to this area, which offers a thorough overview of the organization's financial situation and actions (Ghorbel, 2019). Additionally, to make navigating simple may provide hyperlinks in the Financial Review section that let visitors return to the menu structure or to particular information about the financial metrics under discussion.
The functionality and usability of an Excel spreadsheet may be considerably improved by adding IF statements and a menu system. Accessing data or computations pertaining to sales, direct expenses, bank interest, and machine purchase decisions is made simple for users by navigating the spreadsheet. Making educated judgments about the business's financial information is made easier and more streamlined by this method.
Range: This is the range of cells to which the criterion should be applied. It could consist of a single column, row, or a more intricate group of cells. The condition wish to apply to the cells that fall within the given range is known as the criteria. Depending on the pattern, it may be a particular amount, text, expression respectively, or even a wildcard character. The function increases a counter whenever a match is discovered and maintains track of the number of cells that fit the criteria. The count, which the function returns, is an indication of how many cells met the requirement. Moreover, it is useful for more difficult jobs like counting all values inside a specified date range, less than a specific amount, or larger than a certain number (Ha, 2020). When sorting and categorizing textual data, COUNTIF may be used to count cells that fit a pattern or contain certain content. Counting the number of goods that adhere to particular quality requirements is frequently done as part of quality control procedures.
| COUNTIF (range, criteria) | 24.00 |
| SUMIF (range, criteria, [sum_range]) | -100494747.3 |
| Row Labels | Sum of 24.00 |
| SUMIF | -100494747.3 |
| Grand Total | -100494747.3 |
Table 3: COUNTIF and SUMIF functions
SUMIF is ideal for adding values that satisfy particular criteria. It may be used, for example, to determine the overall sales for a specific product, month, or location. For keeping track of income and spending, it is useful. SUMIF may be used to determine the total earnings or outlays for a certain category or time frame. SUMIF is used by companies to track and manage their inventory.
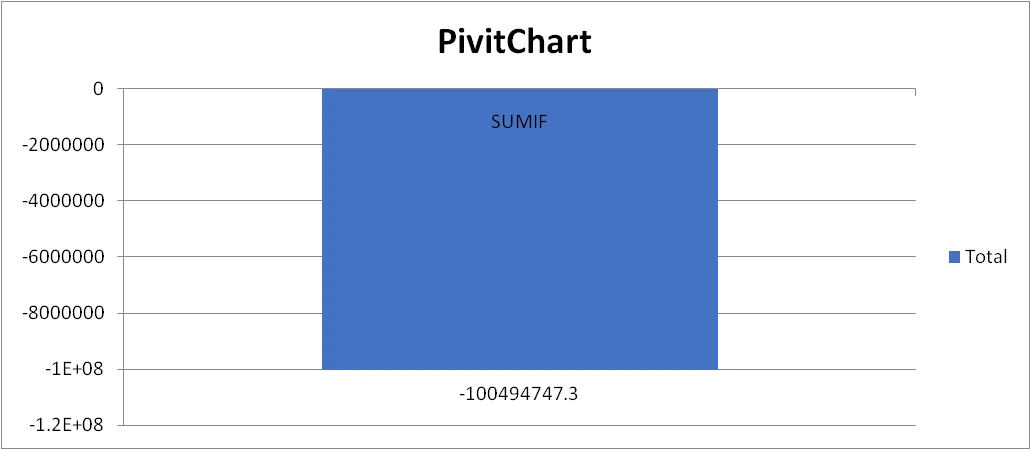
Figure 1: Pivot Chart to analyze start-up cost
The overall starting expenses, which now include the venture capital investment, will be displayed on the graph. This gives a clear picture of how your finances will be affected by the additional funding. Determine the residual money after deducting the venture capital investment's start-up expenditures. For an indication of how much of the investment is still accessible, consult the chart. If the graph has information on budget distribution, it will be possible to see how start-up cash is allocated among various regions. Additionally, to evaluate the start-up’s financial stability and sustainability with the help of the updated chart. Making defensible choices about how to use the investment is made simpler since it gives a clear perspective of your expenses and the amount of money that is available (Sumaryati et al. 2020). Excel pivot charts are flexible tools for financial evaluation and presentation and may be modified to take into account updates and new financial data.
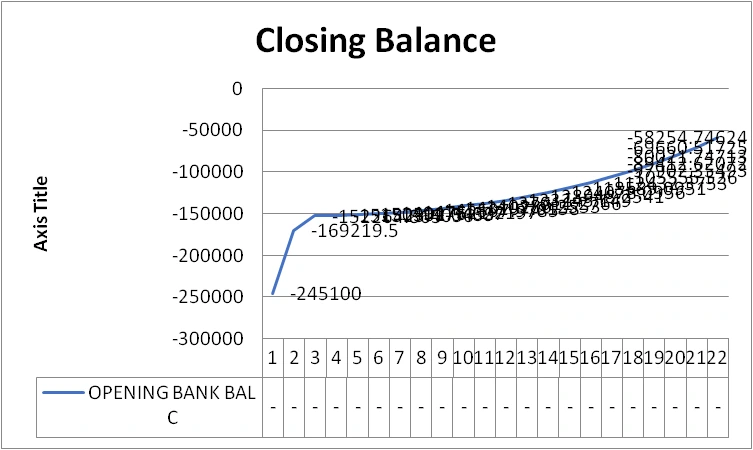
Figure 2: Graphical presentation of the Closing Balances
When preparing budget or making investment selections, the aforementioned chart might be a useful tool. Making a line chart with the closing balances enables a rapid understanding of the company's financial background and performance and may be a useful tool for accounting analysis and decision-making. Starting in February 2024, the price per unit of immediate supplies and variable manufacturing overhead is subject to an inflating rise of 0.45% over the preceding month. Monthly in-arrears payments will be made for direct materials and unpredictable production overhead.
| Closing bank balance | -84,15,100 |
| Target closing bank balance | 2605230.5 |
| WhatIF | -5353827.00 |
Table 4: WhatIF
Calculate the closing bank amount in cell B1 using the data from cell A1. This cell will utilize the value from A1, but it should be the same as your initial calculation in step 3. Determine the absolute disparity between the present closing bank amount (cell B1) and your desired closing bank balance in a different cell, C1. This What-If analysis uses a formula to imitate goal-seeking by progressively changing an input value until the intended financial objective is reached. To regulate the granularity of the modification, change the "StepValue". When Goal Seek is not possible or practicable, this strategy may be helpful.
| Closing bank balance | -84,15,100 |
| Target closing bank balance | 2605230.5 |
| IFERROR | 900000 |
Table 5: IFERROR
Get assistance from our PROFESSIONAL ASSIGNMENT WRITERS to receive 100% assured AI-free and high-quality documents on time, ensuring an A+ grade in all subjects.
To handle any computation mistakes, use the IFERROR function and to make a spreadsheet more user-friendly, may use IFERROR to show a custom warning or leave the cell empty if the calculation might produce an error. Excel Tables include a number of benefits, such as automated formula extension, simple sorting and filtering, and a better-organized presentation of data.
Reference list
Introduction Take the stress out of your academic journey with our professional Assignment Helper, tailored to meet your...View and Download
Introduction Get free samples written by our Top-Notch subject experts for taking assignment help services. ASOS plc...View and Download
Introduction Get free samples written by our Top-Notch subject experts for taking online Assignment...View and Download
Introduction Get free samples written by our Top-Notch subject experts for taking online Assignment...View and Download
Introduction Get free samples written by our Top-Notch subject experts for taking online Assignment...View and Download
ASSIGNMENT 1 Reach your academic goals with confidence, thanks to Rapid Assignment Help’s professional Assignment Help...View and Download
offer valid for limited time only*